← العودة إلى أخبار البحث

#data literacy

data literacy

2 أوراق

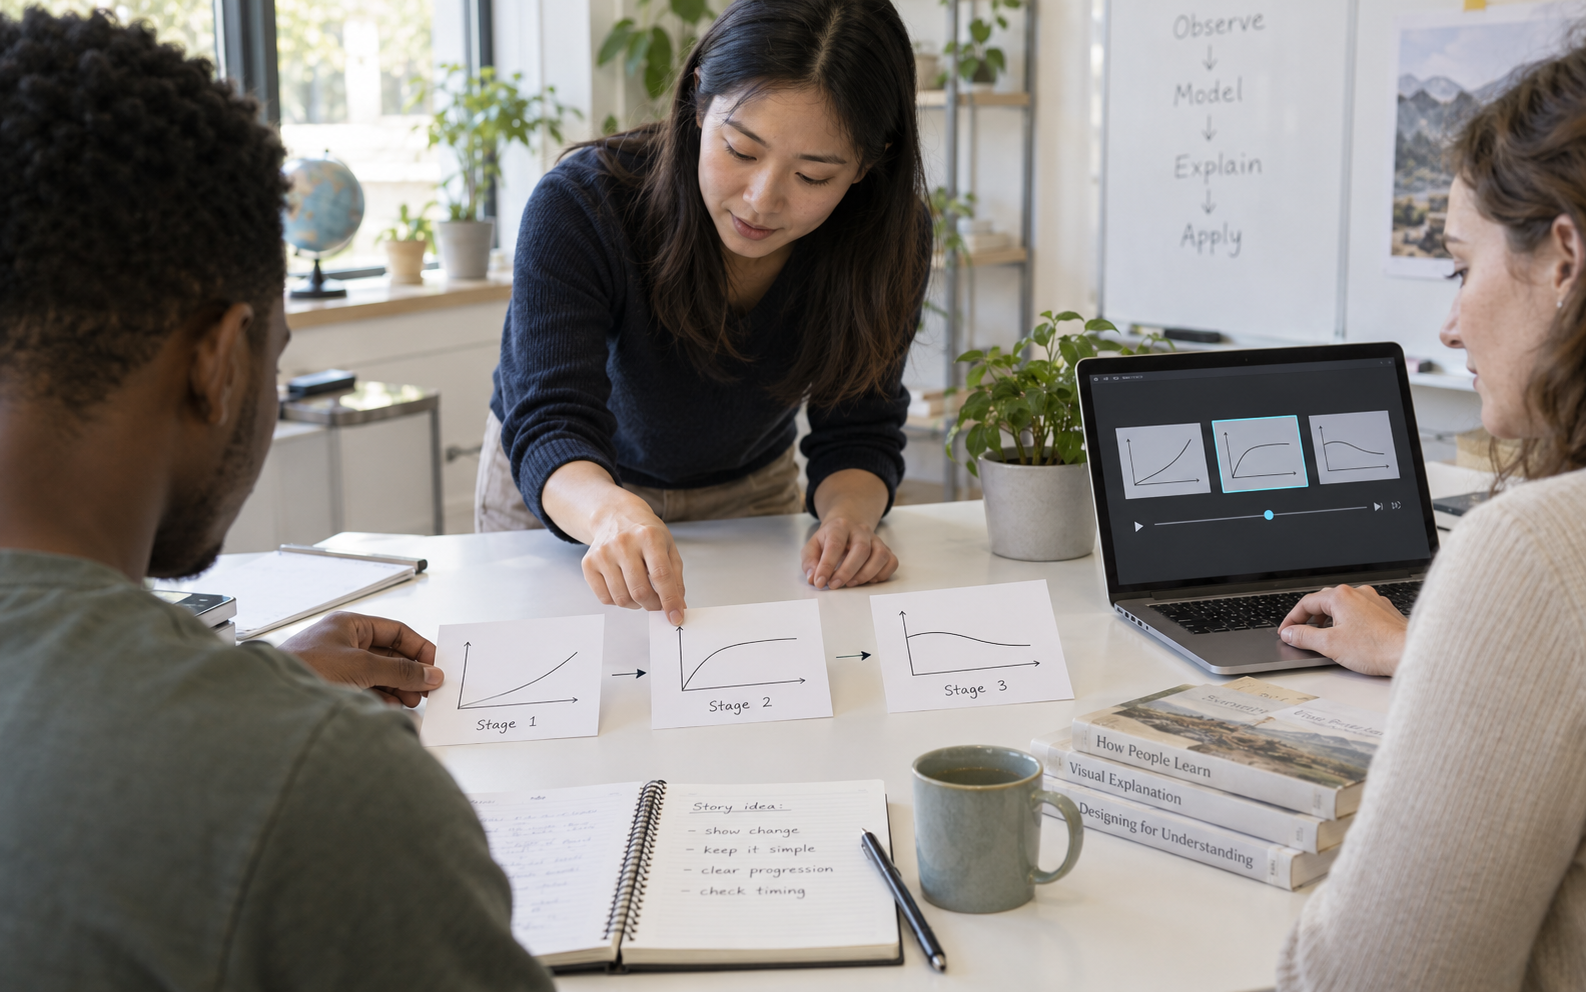
A teacher and student arrange three graph-storyboard cards while a colleague adjusts matching animation frames on a laptop.
سياسة / أخلاقيات8 أكتوبر 2026
سياسة / أخلاقيات 203

Product news: Claude Dashboards and Motion make data and animations more inspectable for teaching

Anthropic

AI Product and Learning Report

Anthropic launched Claude Dashboards and Motion in beta on October 8, with different plan availability, while removing the beta label from Docs, Slides, and Design. Charts expose their underlying queries, and Motion produces editable animation code. OpenAI's learning visualisations and Gemini's classroom tools offer comparisons. For educators, the opportunity is to inspect how a visual was constructed and whether its movement or data presentation helps explain the intended relationship.

product newsClaude MotionClaude Dashboards
اقرأ ملخص 500 كلمة →
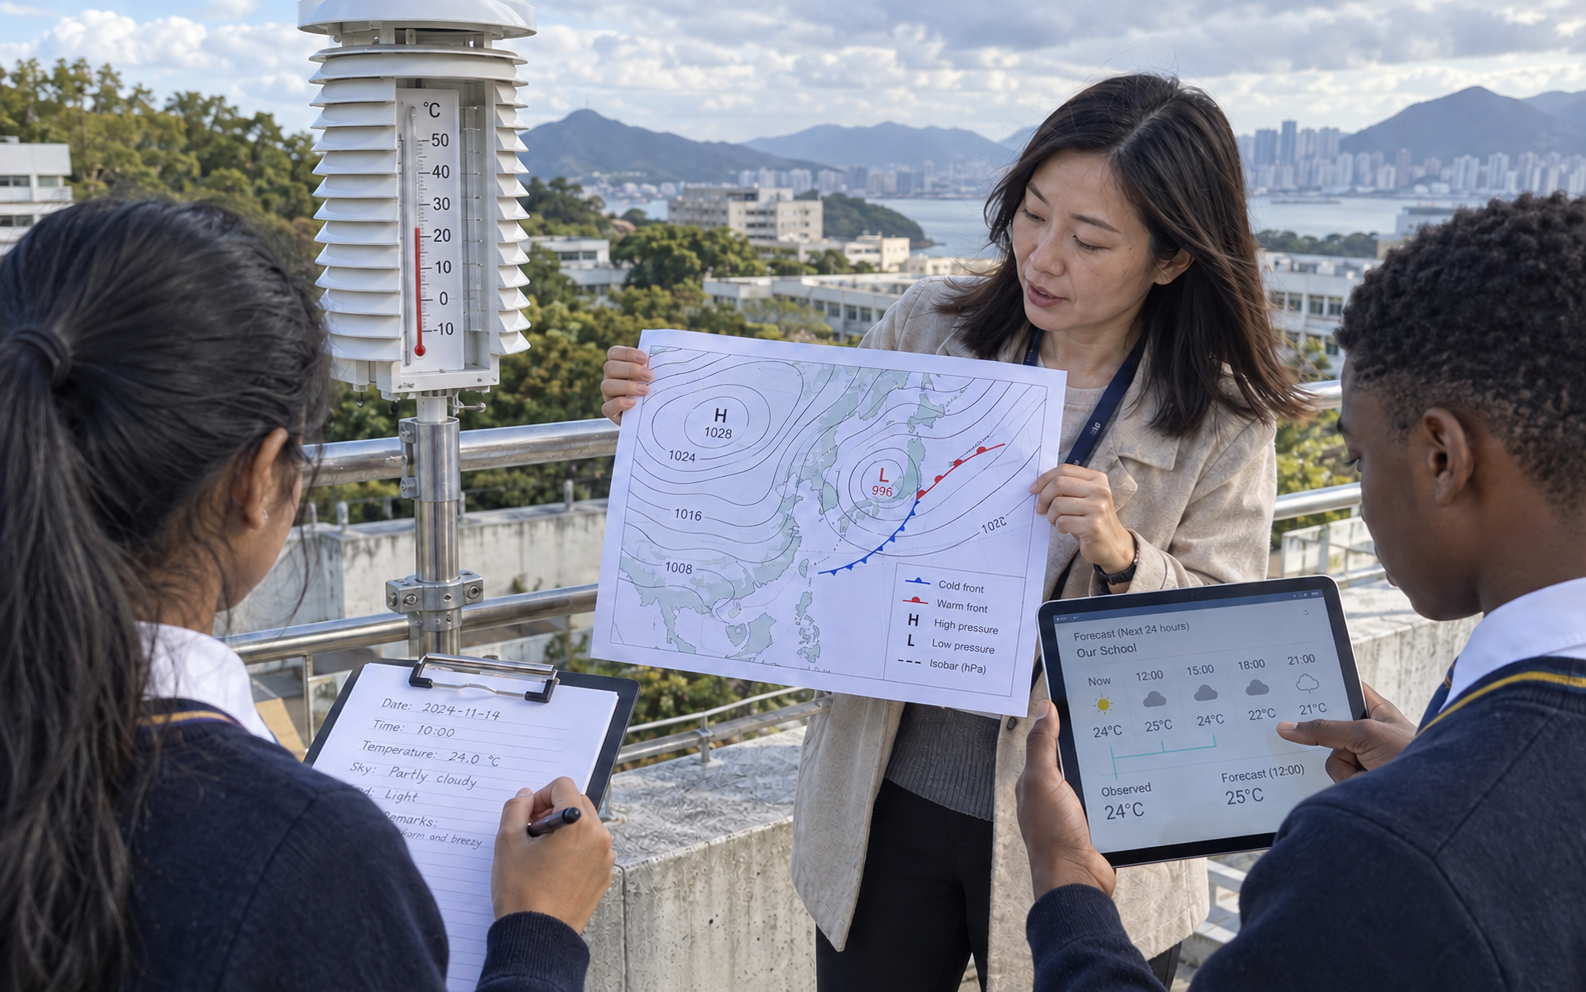
A teacher and two students compare a weather map, a terrace thermometer, and a tablet forecast while a student records observations on a clipboard.
سياسة / أخلاقيات6 سبتمبر 2026
سياسة / أخلاقيات 141

Product news: WeatherNext 3 offers a concrete lesson in AI forecasts, observations, and uncertainty

Google DeepMind

AI Product and Learning Report

Google's September 3 WeatherNext 3 announcement describes forecasts refreshed from recent observations and delivered through products including Gemini. This September 6 report considers its value for teaching data and scientific reasoning. Comparisons with OpenAI's coding workflows and Anthropic's AI-learning guidance keep the focus on human interpretation: students should distinguish observations from predictions, compare like with like, and explain uncertainty rather than treat a sharper map as certainty.

product newsWeatherNext 3Gemini
اقرأ ملخص 500 كلمة →